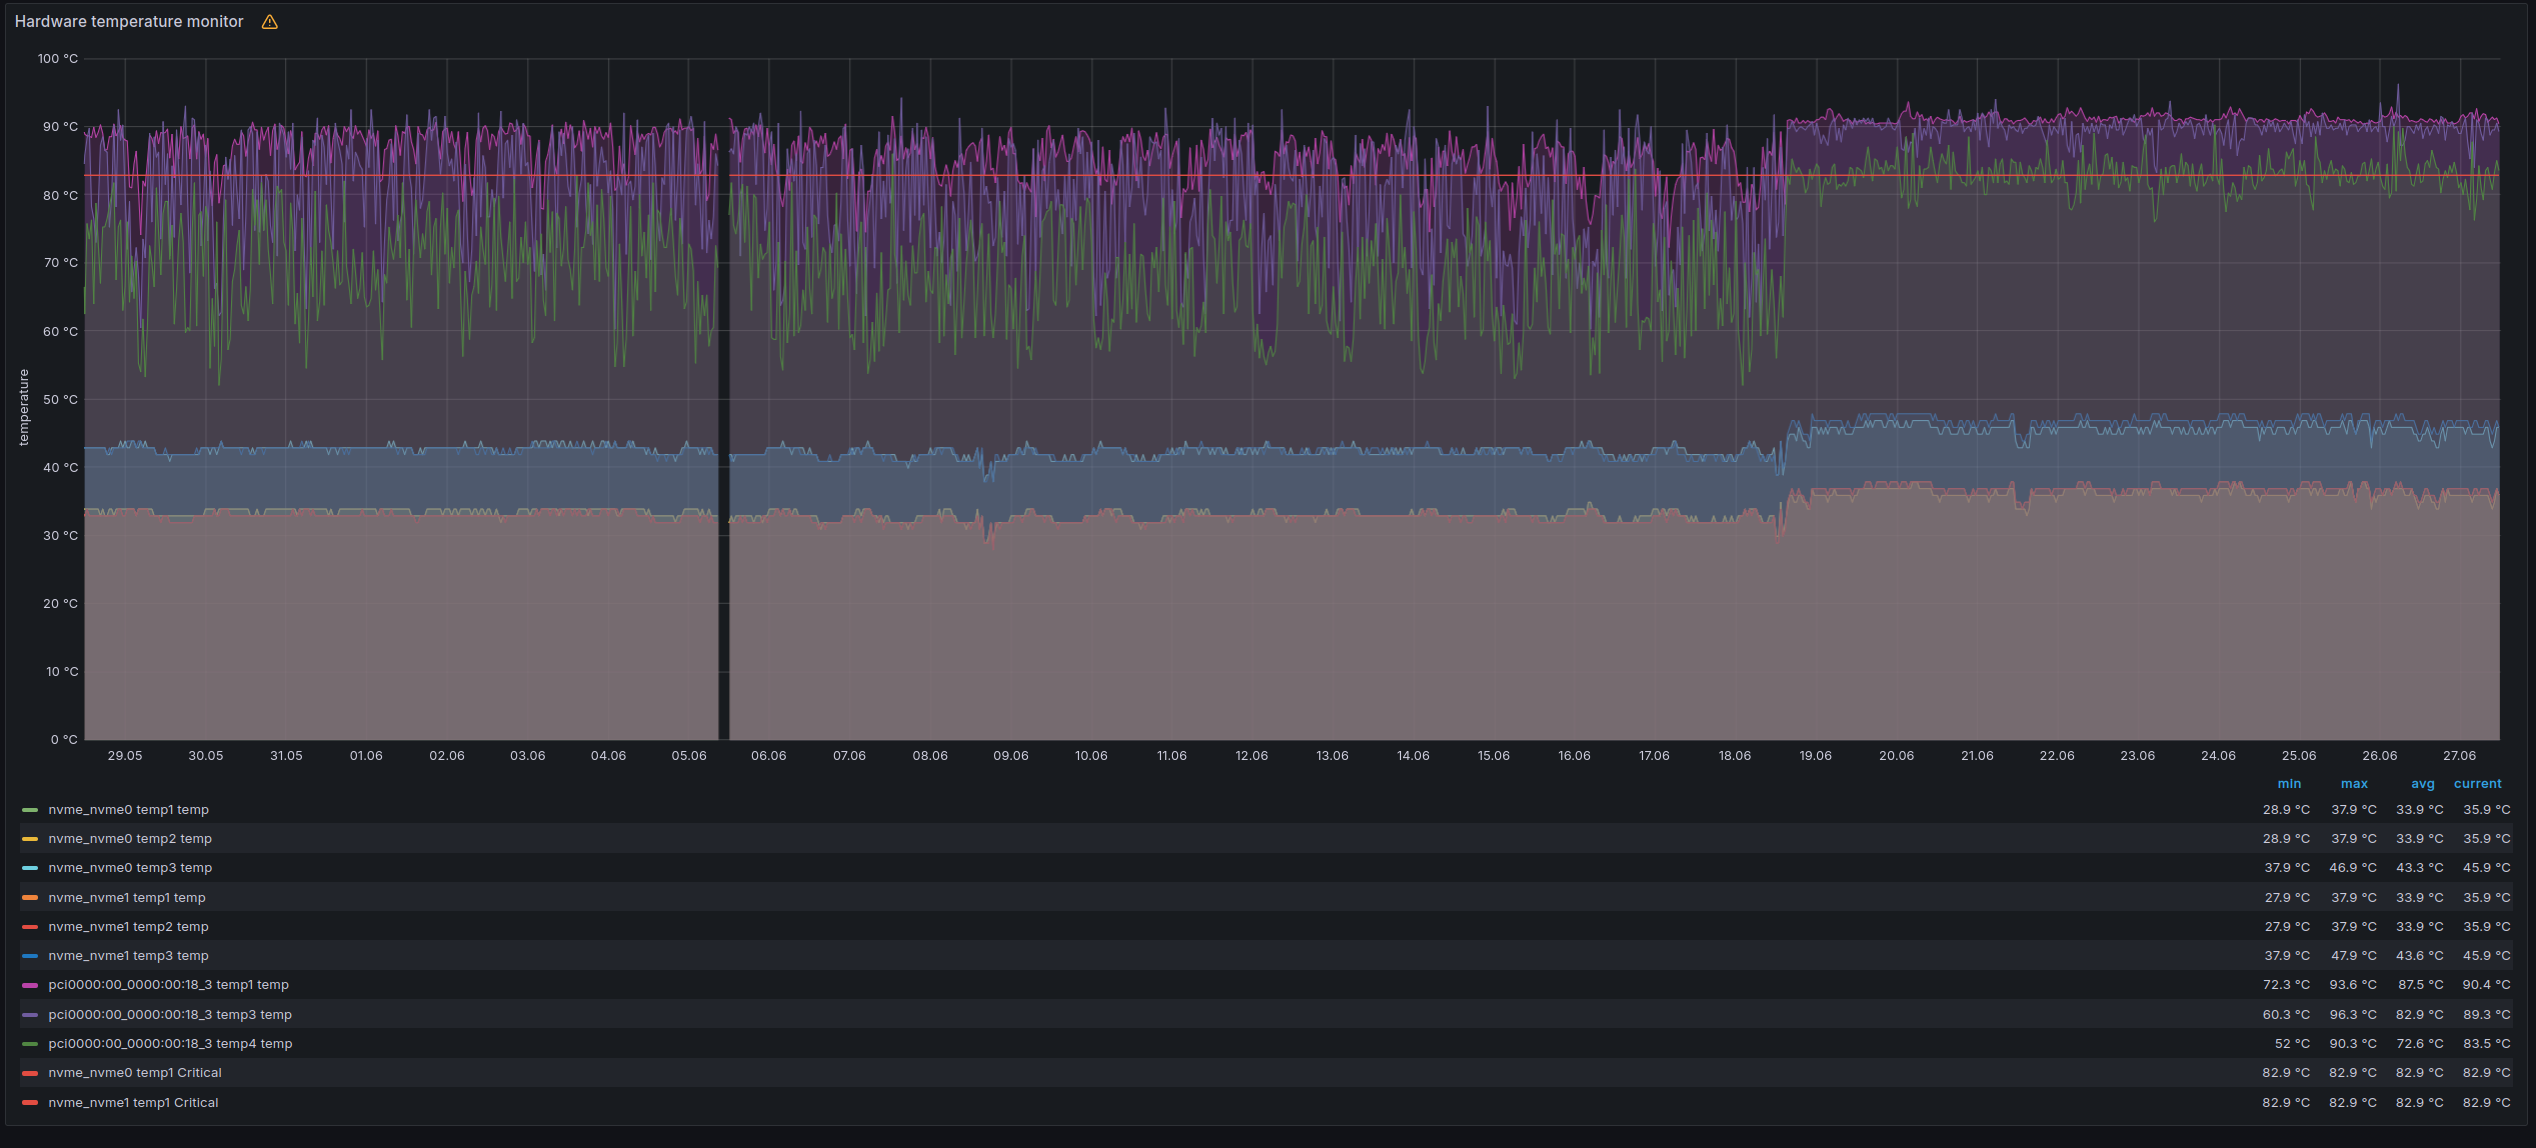
A short and funny story about some problems I debugged the last few days for chaos.social. For 10 days, I could observe a massively increased load on the chaos.social frontend VM, but only on this VM. This issue made chaos.social sometimes very slow to use.

And I have to admit that today I was a bit desperate because, despite a lot of debugging, I couldn’t find the issue.
But a short summary of what has happened until now:
- Block countless bots.
- Work with the developer of FediFetcher to reduce the number of requests by a magnitude.
- Block more IPs with too many requests.
- Analyze everything I could see from the log, including the upstream timings.
- Reboot the system.
- Found some stupid stuff Apple does.
This reduced the load a bit, but nothing really helped sustainably.
Today I decided to check all the metrics of the VM again, but there was simply nothing that was noticeable. Nothing changed starting at 18.6 at 15:30 CEST.
Even though I thought it couldn’t be something on the VM host, I checked it again. I had checked the disks before, but they were fine, and the other VM on the same hosts was not affected. While scrolling again through all the metrics in the Node Exporter Full Dashboard, I found something. The temperature metrics I hadn’t checked before and which are not available on VMs.

Shit, it thought. This spike is exactly at the beginning of the load problems. Sure, there is a link between the load and the temperature of the CPU, but the load wasn’t high enough for such temperatures. So I checked the CPU frequencies, which are exported with the node_exporter but aren’t visible in the dashboard.

And surprise, as I expected, the CPU frequency was far below normal because the CPU tried to drop the clock speed to get the temperature down. And with less computing power, what happens if the traffic is still the same is that the load increases.
Thereafter, we informed a technician at our hoster to check the CPU fan, which, we thought, was the logical source of the issue. Sadly, they reported that it is working, and the load test they did didn’t show any decreases clock speed. Now, after the reboot, everything looks fine again—temperature, clock and load.
It looks like the reboot changed something; maybe the power cycle turned on the fan again, perhaps they putting the server out of the rack, or maybe it was something else and a reboot of the VM host would have been enough. This kind of bug sucks like hell, but they are part of the job. We will keep an eye on the problem and, for now, hope that it will not happen again, but if so, we know what to do, and we fixed a lot on the way to this point. So it’s still a success!